
Table of Contents (Start)
- Topics
- Introducing SevOne
- Login
- Startup Wizard
- Dashboard
- Global Search - Advanced Search
- Report Manager
- Report Attachment Wizard
- Report Properties
- Report Interactions
- Instant Graphs
- TopN Reports
- Alerts
- Alert Archives
- Alert Summary
- Instant Status
- Status Map Manager
- Edit Maps
- View Maps
- FlowFalcon Reports
- NBAR Reports
- Logged Traps
- Unknown Traps
- Trap Event Editor
- Trap Destinations
- Trap Destination Associations
- Policy Browser
- Create and Edit Policies
- Webhook Definition Manager
- Threshold Browser
- Create and Edit Thresholds
- Probe Manager
- Discovery Manager
- Device Manager
- New Device
- Edit Device
- Object Manager
- High Frequency Poller
- Device Summary
- Device Mover
- Device Groups
- Object Groups
- Object Summary
- Object Rules
- VMware Browser
- AWS Plugin
- Azure Plugin (Public Preview)
- Calculation Plugin
- Database Manager
- Deferred Data Plugin
- DNS Plugin
- HTTP Plugin
- ICMP Plugin
- IP SLA Plugin
- JMX Plugin
- NAM
- NBAR Plugin
- Portshaker Plugin
- Process Plugin
- Proxy Ping Plugin
- SDWAN Plugin
- SNMP Plugin
- VMware Plugin
- Web Status Plugin
- WMI Plugin
- xStats Plugin
- Indicator Type Maps
- Device Types
- Object Types
- Object Subtype Manager
- Calculation Editor
- xStats Source Manager
- User Role Manager
- User Manager
- Session Manager
- Authentication Settings
- Preferences
- Cluster Manager
- Maintenance Windows
- Processes and Logs
- Metadata Schema
- Baseline Manager
- FlowFalcon View Editor
- Map Flow Objects
- FlowFalcon Views
- Flow Rules
- Flow Interface Manager
- MPLS Flow Mapping
- Network Segment Manager
- Flow Protocols and Services
- xStats Log Viewer
- SNMP Walk
- SNMP OID Browser
- MIB Manager
- Work Hours
- Administrative Messages
- Enable Flow Technologies
- Enable JMX
- Enable NBAR
- Enable SNMP
- Enable Web Status
- Enable WMI
- IP SLA
- SNMP
- SevOne Data Publisher
- Quality of Service
- Perl Regular Expressions
- Trap Revisions
- Integrate SevOne NMS With Other Applications
- Email Tips and Tricks
- SevOne NMS PHP Statistics
- SevOne NMS Usage Statistics
- Glossary and Concepts
- Map Flow Devices
- Trap v3 Receiver
- Guides
- Quick Start Guides
- AWS Quick Start Guide
- Azure Quick Start Guide (Public Preview)
- Data Miner Quick Start Guide
- Flow Quick Start Guide
- Group Aggregated Indicators Quick Start Guide
- IP SLA Quick Start Guide
- JMX Quick Start Guide
- Metadata Quick Start Guide
- RESTful API Quick Start Guide
- Self-monitoring Quick Start Guide
- SevOne NMS Admin Notifications Quick Start Guide
- SNMP Quick Start Guide
- Synthetic Indicator Types Quick Start Guide
- Topology Quick Start Guide
- VMware Quick Start Guide
- Web Status Quick Start Guide
- WMI Quick Start Guide
- xStats Quick Start Guide
- xStats Adapter - Accedian Vision EMS (TM) Quick Start Guide
- Deployment Guides
- Automated Build / Rebuild (Customer) Instructions
- Generate a Self-Signed Certificate or a Certificate Signing Request
- SevOne Best Practices Guide - Cluster, Peer, and HSA
- SevOne Data Platform Security Guide
- SevOne NMS Implementation Guide
- SevOne NMS Installation Guide - Virtual Appliance
- SevOne NMS Advanced Network Configuration Guide
- SevOne NMS Installation Guide
- SevOne NMS Port Number Requirements Guide
- SevOne NMS Upgrade Process Guide
- SevOne Physical Appliance Pre-Build BIOS and RAID Configuration Guide
- SevOne SAML Single Sign-On Setup Guide
- Cloud Platforms
- Other Guides
- Quick Start Guides
Self-monitoring Quick Start Guide
SevOne Documentation
All documentation is available from the IBM SevOne Support customer portal.
© Copyright International Business Machines Corporation 2024.
All right, title, and interest in and to the software and documentation are and shall remain the exclusive property of IBM and its respective licensors. No part of this document may be reproduced by any means nor modified, decompiled, disassembled, published or distributed, in whole or in part, or translated to any electronic medium or other means without the written consent of IBM.
IN NO EVENT SHALL IBM, ITS SUPPLIERS, NOR ITS LICENSORS BE LIABLE FOR ANY DAMAGES, WHETHER ARISING IN TORT, CONTRACT OR ANY OTHER LEGAL THEORY EVEN IF IBM HAS BEEN ADVISED OF THE POSSIBILITY OF SUCH DAMAGES, AND IBM DISCLAIMS ALL WARRANTIES, CONDITIONS OR OTHER TERMS, EXPRESS OR IMPLIED, STATUTORY OR OTHERWISE, ON SOFTWARE AND DOCUMENTATION FURNISHED HEREUNDER INCLUDING WITHOUT LIMITATION THE WARRANTIES OF DESIGN, MERCHANTABILITY OR FITNESS FOR A PARTICULAR PURPOSE, AND NONINFRINGEMENT.
IBM, the IBM logo, and SevOne are trademarks or registered trademarks of International Business Machines Corporation, in the United States and/or other countries. Other product and service names might be trademarks of IBM or other companies. A current list of IBM trademarks is available on ibm.com/trademark.
About
Self-monitoring involves monitoring SevOne appliances through SevOne NMS, just as you would monitor any of your other devices. Monitoring your appliances helps you detect potential problems and address them immediately. It is also really useful for existing problems, especially when you do not know the source. Sometimes it is not immediately clear what kind of problem you are dealing with - it can be hardware, software, or network level issue. With self-monitoring, you can pinpoint the cause and resolve problems quickly, preventing downtime.
Self-monitoring is a series of SevOne created API scripts that allows monitoring of core SevOne functions such as:
|
Function |
Description |
|
MySQLMon |
Monitors MySQL database performance. By default, both config and data databases are configured for this. |
|
SevOneMon |
Monitors SevOne internal data such as utilization, flow load, etc. |
|
KRONMon |
Monitors SevOne polling daemon performance. |
|
RAIDMon |
Monitors hard drive RAID health of physical appliances. |
The metrics from these functions can be used to create reports and alerts when the state of the self-monitoring indicators changes and may indicate a problem with one of the SevOne peers.
In this guide if there is,
-
[any reference to master] OR
-
[[if a CLI command contains master] AND/OR
-
[its output contains master]],
it means leader.
And, if there is any reference to slave, it means follower.
Starting SevOne NMS 6.7.0, MySQL has moved to MariaDB 10.6.12 .
Prerequisites
-
root access to SevOne NMS appliance using ssh
-
IP address of SevOne NMS appliance
-
SSH client, such as PuTTY
-
Ensure that SevOneStats login is enabled prior to installing self-monitoring
-
The self-monitoring install script. Please contact SevOne Support for the latest install script, install.sh. The install script, which ships with the appliance, is located in /usr/local/scripts/utilities/plugins/selfmon
Prepare Appliance for Self-Monitoring
To prepare your appliance(s) for self-monitoring, execute the steps in the following sections.
Enable SevOneStats User & Change Password
By default, SevOneStats user account is disabled; enable it. Once enabled, change SevOneStats password as the default password can result in security issue.
If SevOneStats password is changed once self-monitoring is already in progress, it can interrupt the process.
Do not change SevOneStats password after self-monitoring is enabled. Doing so can result in self-monitoring process to stop.
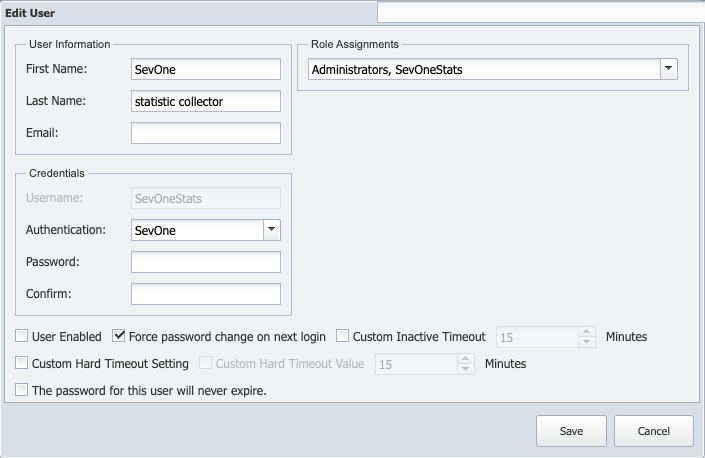
Execute the following steps to enable SevOneStats user account and to change its default password.
-
From the navigation bar, click Administration and select Access Configuration, then User Manager.

-
In the Search text field, type SevOneStats.
-
Select the check box for SevOneStats and click
 to display the Edit User pop-up.
-
In the Email field, enter an email address. An email address is required here in order to save the changes you will be making in the next steps.
-
Under Credentials, locate the Password text field and enter a new password.
-
In the Confirm text field, reenter the password.
-
At the bottom of the pop-up, select the User Enabled check box to enable the SevOneStats user account.
-
If the Force password change on next login check box is selected, clear it. This is important because it will ensure that a password change is not required on the next login.
-
Select the Custom Inactive Timeout check box to enable the user to stay logged on during periods of inactivity for the amount of minutes you enter in the Custom Inactive Timeout field. This setting overrides the Inactivity Timeout setting you enter on the Cluster Manager > Cluster Settings tab. Leave clear to have the user log off after the amount of time you enter on the Cluster Manager. The user must log out and then log back on for this setting to take effect.
-
Select the Custom Hard Timeout Setting check box to enable and use customized Hard Timeout setting (for the user you are adding or editing) you define on the Cluster Manager > Cluster Settings tab > Security subtab.
-
To customize the hard timeout value for a user, select the Custom Hard Timeout Value check box to enable editing the hard timeout value for the user that you are either adding or editing. Enable the checkbox to allow you to enter the number of minutes in value field the user can remain alive before SevOne NMS automatically logs them out of the application. The default value is 15 minutes. Value field can range between 5 minute to 86400 minutes (60 days). When Custom Hard Timeout Value is enabled, the timeout set in its value field is used for the user in add or edit mode instead of the Hard Timeout value set on the Cluster Manager > Cluster Settings tab > Security subtab.
-
To prevent the password from expiring, select the check box for The password for this user will never expire.
-
Click Save.
Verify credentials / Check permissionsExecute the following commands to verify the credentials.
$/usr/local/scripts/utilities/plugins/selfmon/testApiUser.php -u SevOneStats -p <password>If the credentials are correct, it will return 1.
The Self-monitoring install process verifies that SevOneStats ID has the following permissions.
-
Can view reports
-
Can view alerts
-
Can create devices
If SevOneStats has more or less permissions set, the installer will stop and warn about improper permission settings. To verify/modify the permissions, from the navigation bar, click Administration and select Access Configuration > User Manager. Search for SevOneStats user and set the permissions.
-
Add SevOne Appliance to Device Manager
To monitor your SevOne appliance or any other device, you need to add it to Device Manager
-
Select the appliance that you would like to monitor your appliance from. You will be working from that appliance. For example, let's say you want to set up Appliance A to be monitored, and you have decided that Appliance B will do the monitoring. That means you will need to work from Appliance B.
-
Now that the appliance is selected that will do the monitoring i.e., Appliance B, log into SevOne NMS on that appliance.
-
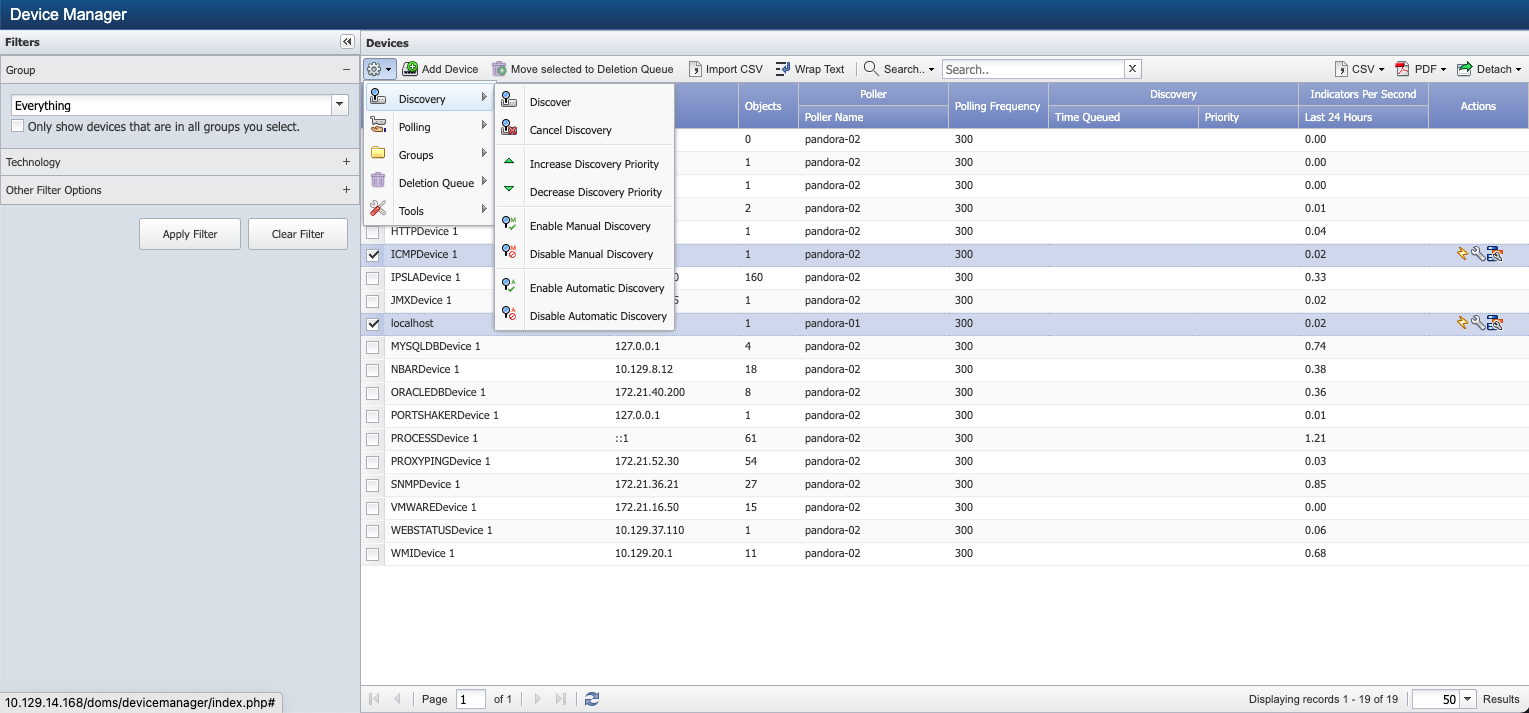
From the navigation bar, click Devices and select Device Manager.
-
On the right, under Devices, click Add Device.
-
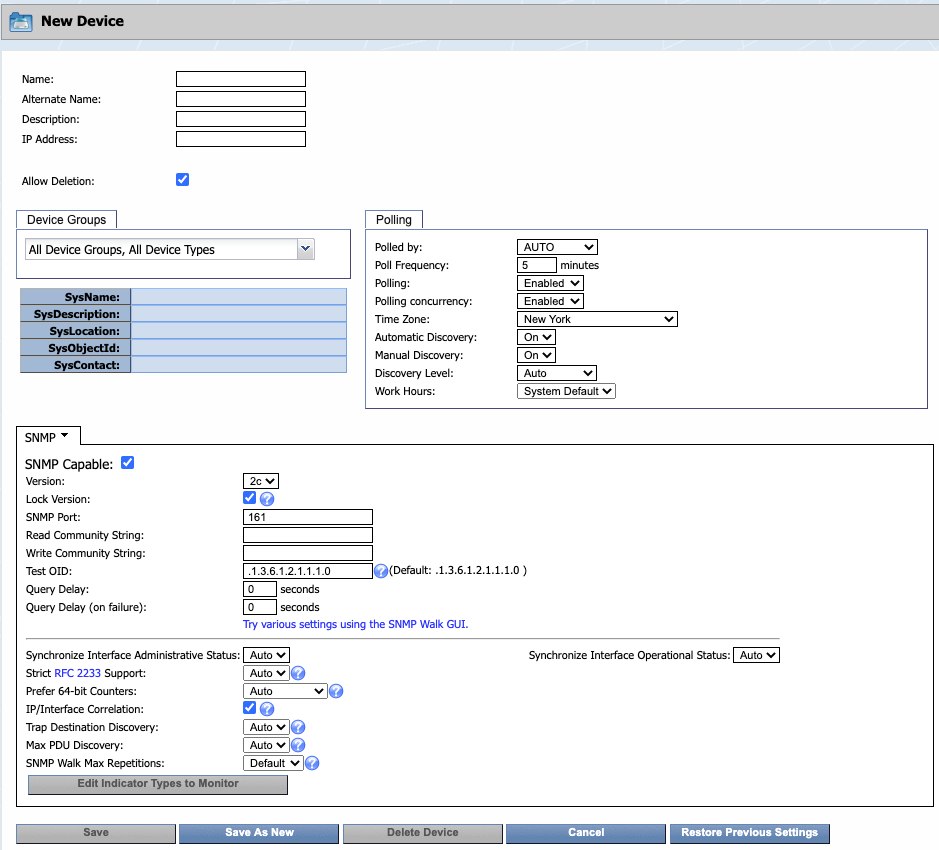
At the top of the New Device page, in the Name field, enter the name of the appliance that you want to monitor.
-
In the Alternate Name field, enter an alternate name for the appliance. Users can search for the appliance by this name.
-
In the Description field, enter a description of the appliance. You can use this to provide additional information about the appliance, such as location, etc.
-
In the IP Address field, enter the IP address of the appliance.
-
The Allow Deletion check box appears to the admin user only and is selected by default. When selected, it enables users to delete the device. If you would like to prevent users from deleting the appliance as a device, clear the check box.
-
Below that, click the Device Groups drop-down and select All Device Groups.
-
Configure other settings as needed. For additional details, please refer to SevOne NMS User Guide > sections New Device / Edit Device for adding / editing devices respectively.
If Self-monitoring is installed prior to manually adding devices in SevOne NMS, those devices will get added automatically as a result of installing self-monitoring.
-
Click Save As New.
-
You will see a message at the top of the page to inform you that the device is being queued for discovery.
Enable Self-monitoring on Appliance
Execute the following steps to enable self-monitoring on the appliance you want to monitor.
Do not change SevOne Stats password once self-monitoring is enabled as it can cause the self-monitoring process to stop.
-
Using ssh, log into the appliance that you want to enable self-monitoring on.
-
Run the install.sh script and follow the prompts.
Prior to installing self-monitoring, ensure that the appliance is in its final state, peered into the correct cluster, and has an IP address assigned to it.
$/usr/local/scripts/utilities/plugins/selfmon/install.sh-
You will see a couple of warnings followed by the text Press Ctrl-C to abort or any key to continue... Hit Enter to proceed.
-
You will see one more message, Press Ctrl-C to abort or any key if you are sure... Hit Enter again.
-
You will be prompted to Enter the password for the API user SevOneStats.
Now you will see some information about your appliance such as, number of peers, whether the appliance is part of an HSA pair, and the IP address used for it. After this, the installation process starts. You will see a long list of information, especially about objects and indicator types. Once done, you will receive confirmation that the installation is complete.
-
-
Validate self-monitoring has been installed by checking the root user's crontab for the following lines.
*/5* * * * php/usr/local/scripts/utilities/plugins/selfmon/RAIDMon/poll.megacli.objects.php -i"2"--api'127.0.0.1'>>/var/SevOne/RAIDMon.log 2>&1*/5* * * */usr/local/scripts/utilities/plugins/selfmon/SevOneMon/sevone.deferreddata.poll.sevone --api 127.0.0.1 --device-id"2"--object'SevOne Statistics'>>/var/SevOne/SevOneMon.log 2>&1*/5* * * */usr/local/scripts/utilities/plugins/selfmon/MySQLMon/sevone.deferreddata.poll.mysql --api 127.0.0.1 --device-id"2"--database 127.0.0.1:3307 --object'MySQL Config Database'--database-profile"config">>/var/SevOne/MySQLMon.log 2>&1*/5* * * */usr/local/scripts/utilities/plugins/selfmon/MySQLMon/sevone.deferreddata.poll.mysql --api 127.0.0.1 --device-id"2"--database 127.0.0.1:3306 --object'MySQL Data Database'--database-profile"data">>/var/SevOne/MySQLMon.log 2>&1*/5* * * * php/usr/local/scripts/utilities/plugins/selfmon/PolldMon/deferreddata.polld.php --api 127.0.0.1 --device-id"2"--polld-object'SevOne-polld performance'--highpolld-object'SevOne-highpolld performance'>>/var/SevOne/PolldMon.log 2>&1*/5* * * * php/usr/local/scripts/utilities/plugins/selfmon/RedisMon/sevone.deferreddata.poll.redis --api 127.0.0.1 --device-id"2"--object'Redis Instance'>>/var/SevOne/RedisMon.log 2>&1It is best practice that a self-monitored appliance added as a device is not polled by itself; i.e., the appliance for which the self-monitoring is installed should not be the polling peer for the configured device. For additional details, please refer to SevOne NMS System Administration Guide > section Device Mover.
Create Object Rules
By creating object rules, you can make sure you are monitoring the objects you want to monitor on your SevOne appliance. You can also use object rules to exclude the objects that you do not want to monitor. Please refer to SevOne NMS System Administration Guide > section Object Rules for details on creating object rules.
What to Monitor
In this section, various components such as, CPU, Disk, RAID, etc. will be monitored. Along with this, focus will also be on the ideal ranges, signs of trouble, and some of the available indicators.
CPU
The main focus is on the total aggregate CPU usage. Looking at the sum of the CPU cores rather than at individual cores provides an overview of the CPU activity. If there is a problem with the total aggregate usage, it may be a good idea to start looking at individual cores to determine whether it is related to specific cores or all cores. This helps in determining whether the problem is related to a particular process or to the entire system.
Ideally, CPU usage will be in the following ranges.
-
Idle time >= 50% - most of the time, the CPU should not be doing a whole lot.
-
Waiting time <= 10% - if the waiting time is consistently 10% or higher, the system is too much in wait mode and must be looked into.
Disk
When looking at disks, the two main areas of focus are free disk space and input/output (I/O). The typical SevOne appliance has three main disk components.
-
sda
-
/ - contains the entire operating system, including libraries, executables, etc.
-
/index - is used by the database for indexing activities. Allows distribution of read/write requests across another disk to improve performance.
-
-
sdb
-
/data - contains large amounts of data (covering long time spans), flow data, etc.
-
-
fioa
-
/ioDrive - optional Fusion-io SSD, included with higher-capacity appliances.
-
The following are the ideal amounts of free disk space.
-
/, /ioDrive >= 20% free
-
/data >= 10% free - if this is too full, the database can freeze up.
SNMP reports I/O statistics for entire disks as well as the individual partitions of each disk. For self-monitoring purposes, the entire disk is of interest. The following are three I/O states.
-
I/O is low - this means there is not much activity at the moment - so, nothing to worry about.
-
I/O is up and down - this means that there is some read/write in progress - this is usual work and no cause for concern.
-
I/O is high - if it is consistently high, this means that the disk is constantly reading and writing. This is a red flag and requires a closer look.
One possible cause of high I/O is hot standby synchronization, which involves copying lots of data from one appliance to another. However, it is always good to check into the exact cause of high I/O.
RAID
By monitoring RAID, you can get information about potential disk failure before it happens. You can then take appropriate action to ensure that the performance is minimally affected or not affected at all. The important to keep in mind are the following.
-
RAID array state. This applies to the array. The RAID array state should be 4. Anything other than 4 is cause for concern.
-
RAID disk predictive failure count. This applies to the individual disks that make up the array. Predictive failures result from trends of certain errors and act as warning signs, indicating that you may need to replace the disk.
-
RAID disk firmware state. This also applies to individual disks. The firmware state should be 7. If it is not 7 on any of the disks, then there may be a problem with that disk.
Memory
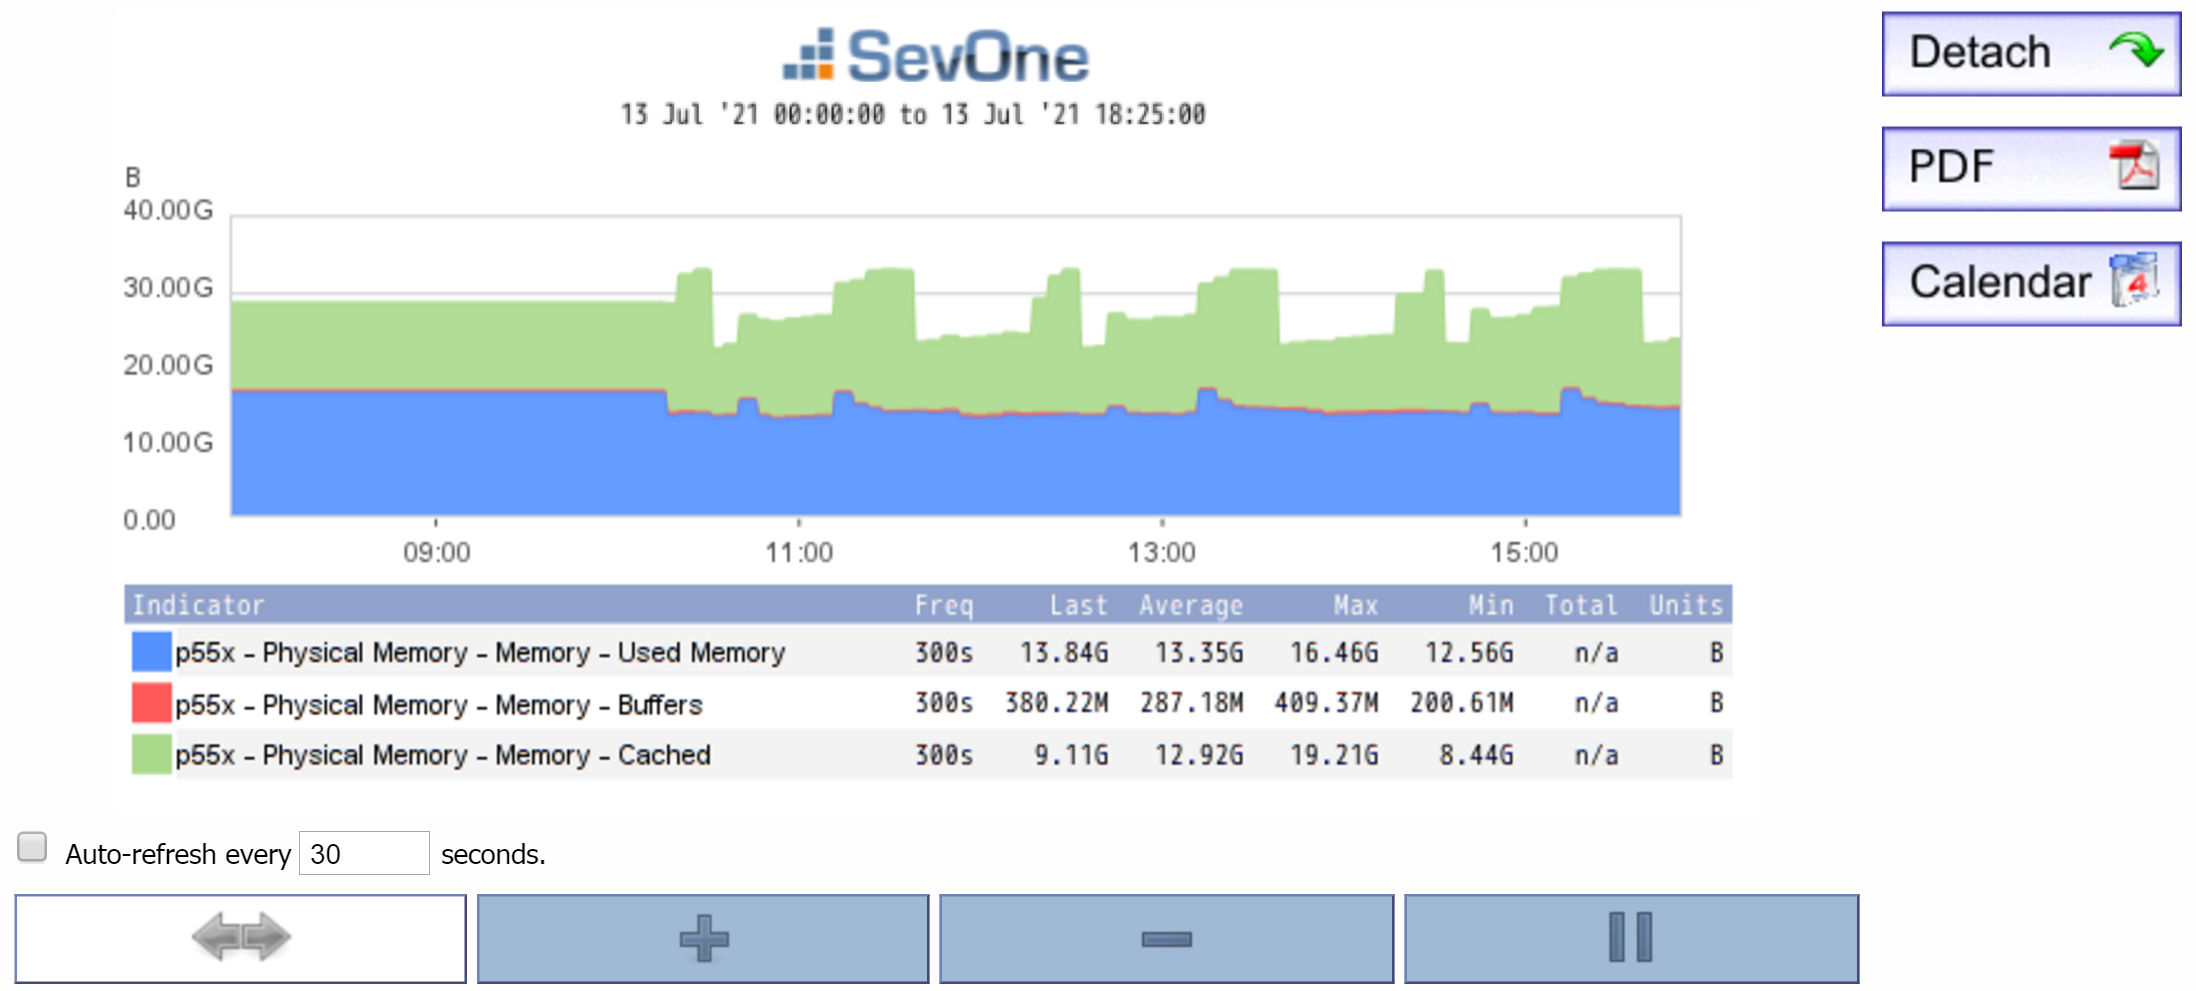
Memory applies to SevOne appliances. You will notice high memory usage. Depending on how much RAM an appliance has, it may be close to 100% memory usage. For appliances with greater RAM, memory usage will be high (due to Linux kernel caching) but not close to 100% usage. For example, if you write to a file and there is free space in RAM, the kernel will store the entire file in the RAM. So, when you read/write from/to the file, you are reading/writing from/to memory; making the process fast. The kernel then caches the file to the disk.
SevOne appliances ship with a lot of memory. Due to this, there is almost never a need to do the swapping. However, if a swap is required, it should not be over 1 GB. Before the swap, it is important to know why the memory needs to be swapped. The possible causes may include:
-
Memory leak
-
A poorly designed script
Used Memory
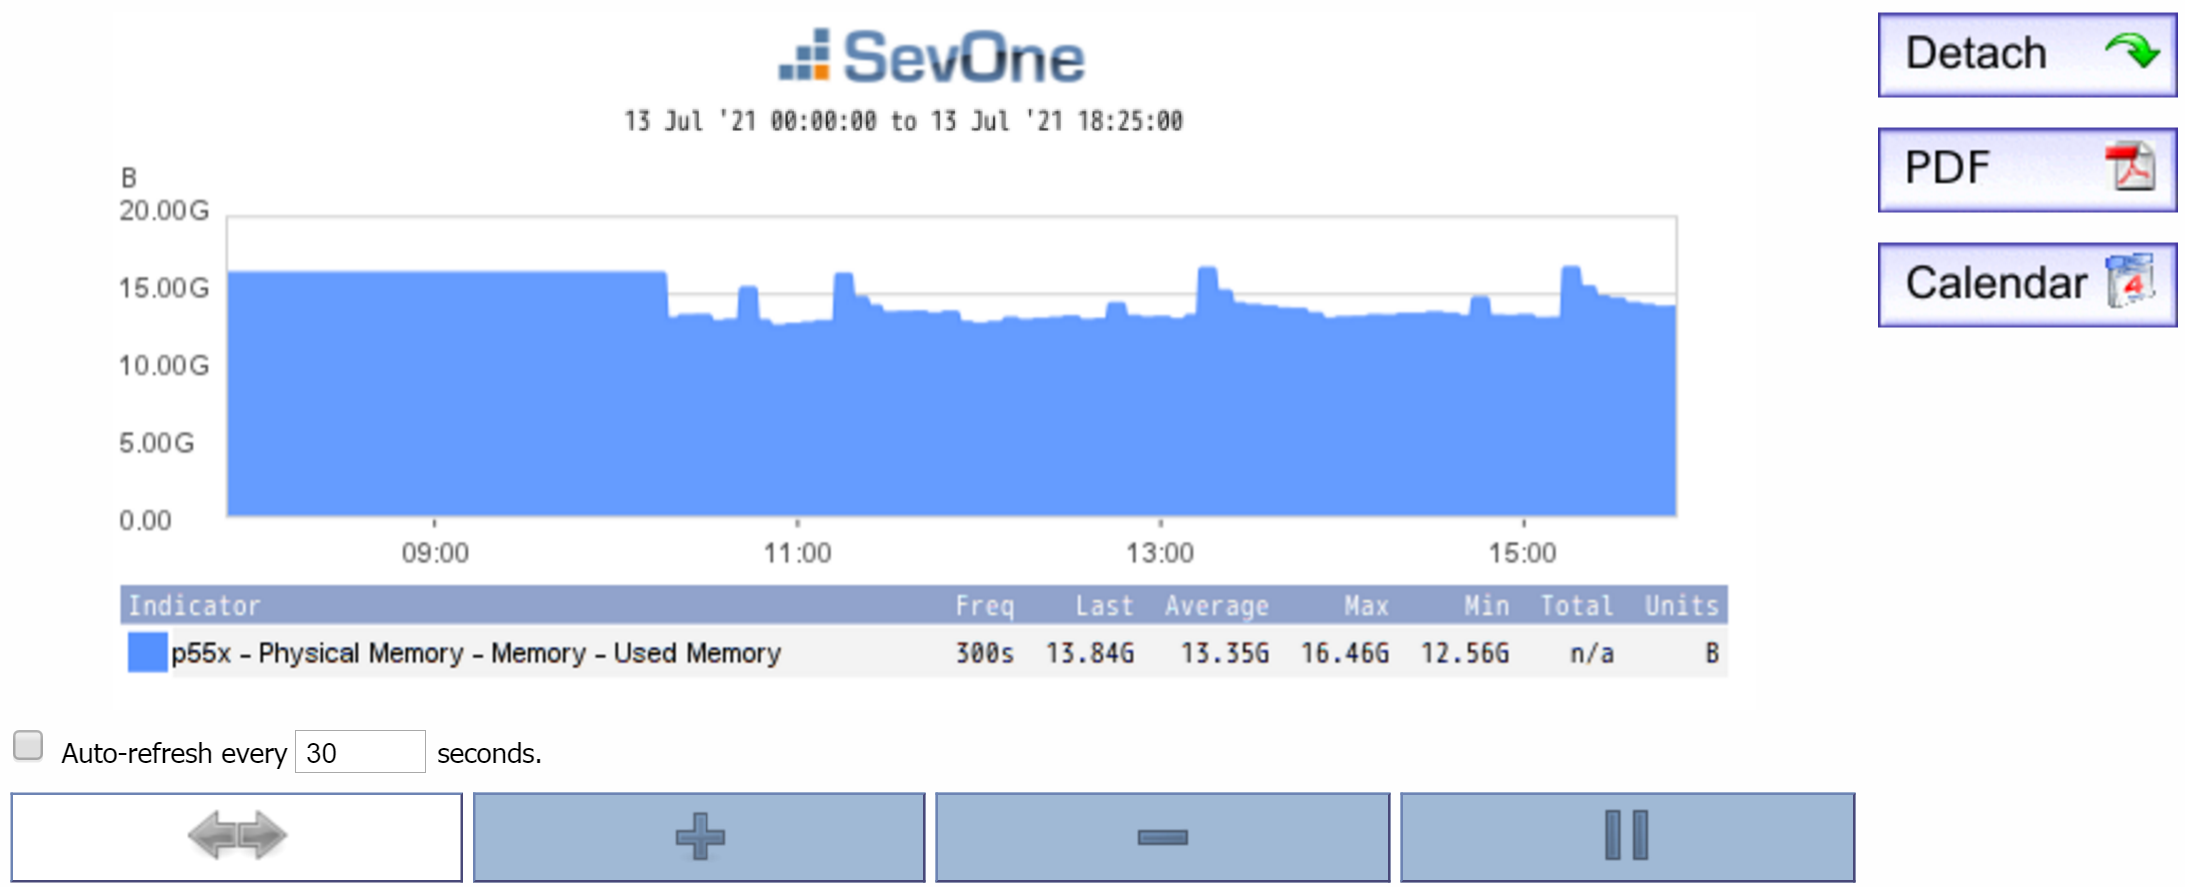
SNMP stats can be used to determine the amount of used memory. Along with indicator, Used Memory, you may also include Cached indicator and Buffers indicator to determine a more accurate usage of memory as some of it will be cached.
Processes
All processes with SevOne as part of its name, must be monitored. Process monitoring can be done using Process Poller and SNMP.
Process Poller
The Process Poller provides statistics for processes related to the following.
-
Apache
-
Bash
-
CRON scheduler
-
MySQL
-
PHP
-
xStats
-
etc.
Please refer to Process Poller monitoring information in SevOne NMS for a list of processes that are identified and monitored for the following information.
-
Availability
-
CPU Time
-
Instances of the process
-
System memory used - this refers to actual memory and does not include virtual memory.
SNMP
All major SevOne NMS processes connect to the database and issues queries. Every SevOne daemon exports SNMP information about its database use. You can look at the following daemons with SNMP.
-
SevOne-clusterd
-
SevOne–datad
-
SevOne-dispatchd
-
SevOne-polld
-
SevOne–requestd - provides percentage of requestd availability for each peer. An alert is raised when the availability is < 100%.
-
SevOne-trapd
-
and others...
The exact list of processes depends on which appliance type is being monitored. For example, PAS, HSA, or DNC.
SNMP indicators provide several database statistics for processes. The following are a few to keep a watch on.
-
Query counts - any sudden changes in query counts may indicate a problem.
-
Query errors - query errors may be the result of a schema or a code issue.
-
Number of connections.
-
Number of reconnections.
-
Number of traps received, processed, etc. (applies to SevOne-trapd). Please make sure that the number of traps received is not much different from the number of traps processed. The numbers should be close to each other (within 100, for example). If the difference between traps received and traps processed is large, then you may be receiving more traps than the amount that can handled.
Hot Standby Appliance
A hot standby appliance (HSA) consists of an active peer and a passive peer. The active peer pulls configuration data from the Cluster Leader (in the case of a cluster) and polls data from objects and indicators on the devices that are assigned to it. The passive peer maintains a redundant copy of all configuration data and poll data. If you have a HSA, make sure that:
-
MySQL replication is working. If Availability drops to 0%, then there may be an issue with the MySQL daemon, mysqld.
-
the poller is running on the active appliance and not the passive appliance.
-
there is a lot of database activity on the active appliance but not the passive appliance.
For HSA monitoring, SevOne recommends using the Deferred Data plugin. Select the SevOne Statistics object (for example, when using Instant Graphs) and the following indicators:
-
Is master - indicates whether a peer is the leader.
-
Is primary - indicates whether a peer is the primary.
If the passive peer of an HSA is reporting an Is master value of 1, this indicates that a switchover has occurred. If both the active peer and the passive peer are reporting an Is master value of 1, then a split-brain condition exists.
Interface
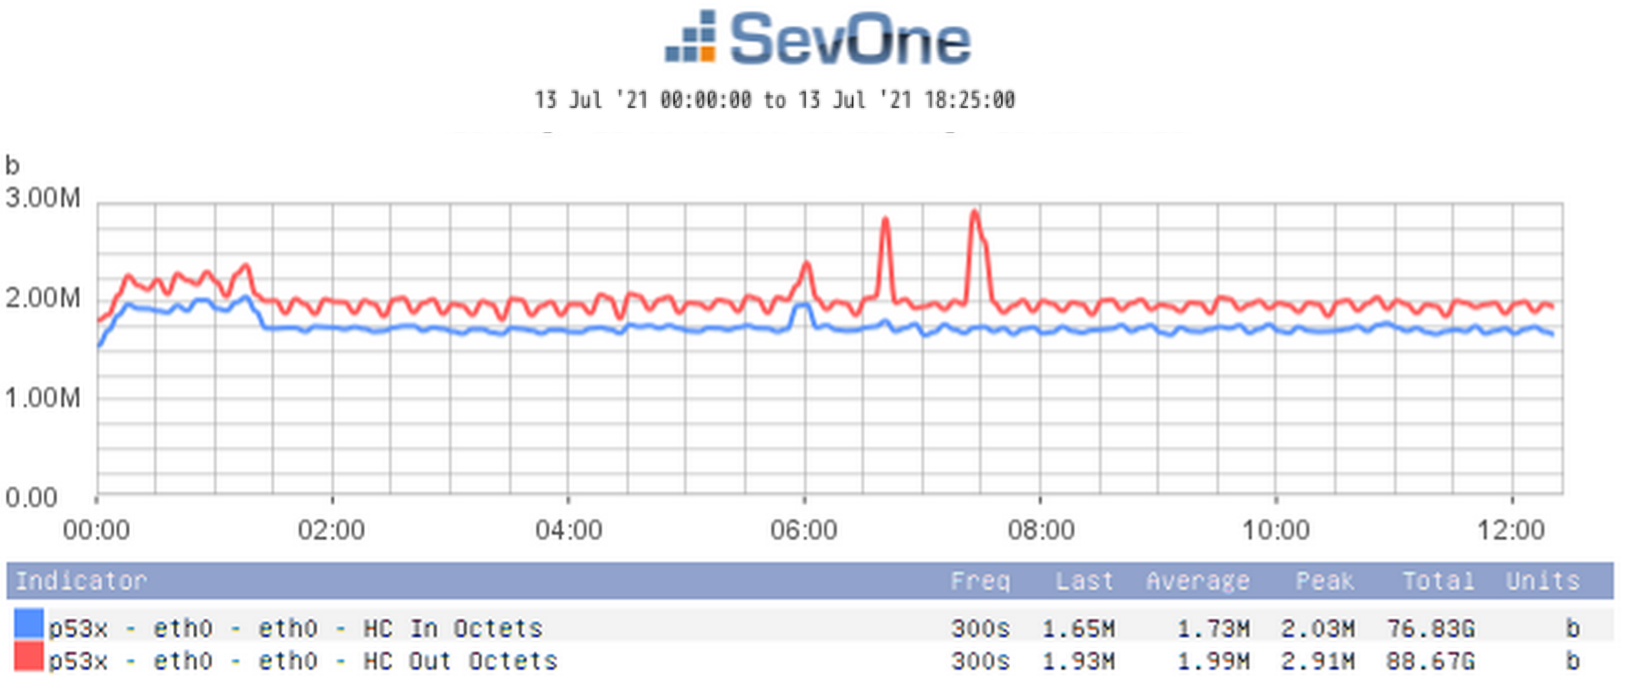
Because SevOne NMS monitors network devices, your SevOne appliance requires some bandwidth but not much. The normal range for a single appliance falls somewhere between 1 and 3%. For an HSA, you will see anywhere from two to four times as much bandwidth used. If the amount of bandwidth used is consistently high, this could indicate a problem, and you will need to look into what is causing the high bandwidth.
With an HSA, you will see peaks in traffic every two hours. This happens because data is being transferred from short-term storage to long-term storage, which results in additional MySQL replication.
The graph below displays bandwidth information using the indicators HC In Octets and HC Out Octets.
Ready for Self-monitoring
Create Policy
Policies allow you to receive alerts when condition(s) specified in the policy are triggered. From policies, you may define thresholds for the device and object groups. Please refer to SevOne NMS User Guide > section Policy Browser for details on creating / editing a policy.
In section Recommended Policies & Thresholds, you will find policies recommended for SevOne self-monitoring. Create a policy.
Create Threshold
Policies apply to entire device groups or object groups. Thresholds can be used to to receive alerts when conditions are triggered for a specific device. Please refer to SevOne NMS User Guide > section Threshold Browser for details on creating / editing a threshold.
In section Recommended Policies & Thresholds, you will find thresholds recommended. Create a threshold.
Alerts
To access the Alerts page from the navigation bar, click Events and select Alerts. The Alerts page allows you to look at the current, active alerts in the system. These include the threshold violations, trap notifications, and web site errors defined in the Policy Browser or the Threshold Browser.
The alerts page allows you to add filters to focus on the display results. After filters are added, click Apply Filter for the filters to be applied.
Filters are optional.
Please refer to SevOne NMS User Guide > section Alerts for details.
Instant Graphs
To access the Instant Graphs page from the navigation bar, click Reports and select Instant Graphs. You may create statistical graphs for the objects and indicators on devices. Instant graphs are easy and fast to set up and allows you to immediately look at the potential problem areas.
Recommended Policies for Self-monitoring
This section includes the following four tables, which break down groups of policies by the component they apply to.
-
SYSTEM POLICIES
-
CORE PROCESS POLICIES
-
CONFIGURATION POLICIES
-
XSTATS POLICIES
Each table contains a list of SevOne recommended self-monitoring policies and includes the following information for each policy.
-
Policy - name and description of the policy.
-
Applies to - whether the policy applies to the PAS, HSA, DNC, or any combination of these.
-
Plugin - plugin used when creating the policy.
-
Alert Condition - specific information for setting up the policy trigger condition(s). This includes object type, severity level and the condition specifications.
-
Clear Condition - specific information for setting up the policy clear condition(s). This includes the condition specifications.
-
Suggested Remediation Steps - recommended steps to take in case a condition is violated.
-
Details - any additional information.
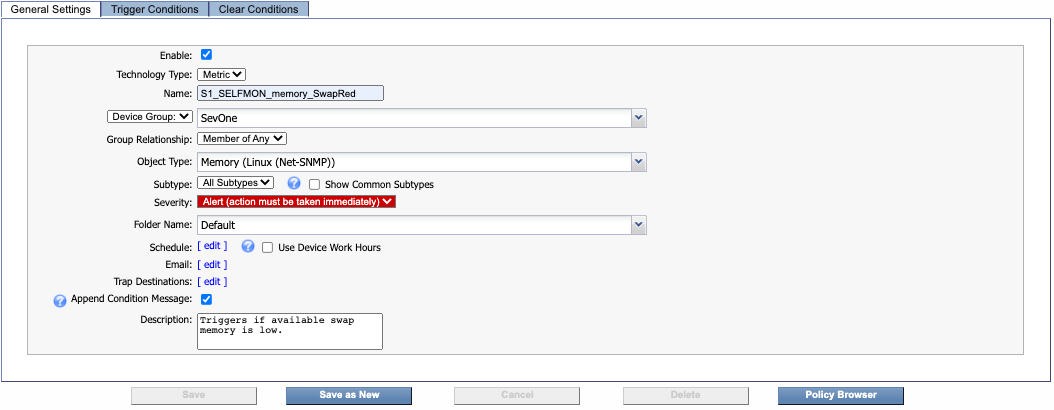
The Plugin, Alert Condition, and Trigger Condition columns provide the specific information required for creating a policy.

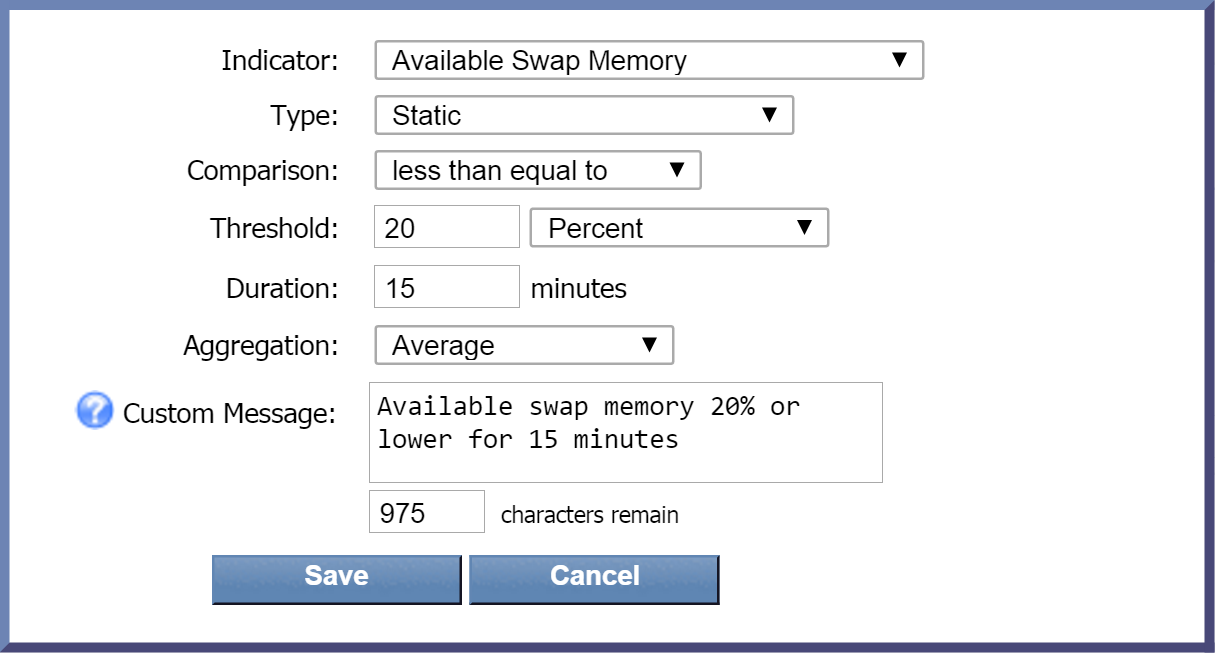
Type drop-down is set to Static by default. For most of the conditions in the table, you will not need to change the default. There are a few conditions in the table where Type is set to Baseline Delta, Baseline Percentage, etc., for example. These exceptions are noted in the Alert Condition column. Unless otherwise noted, the Type will be Static.
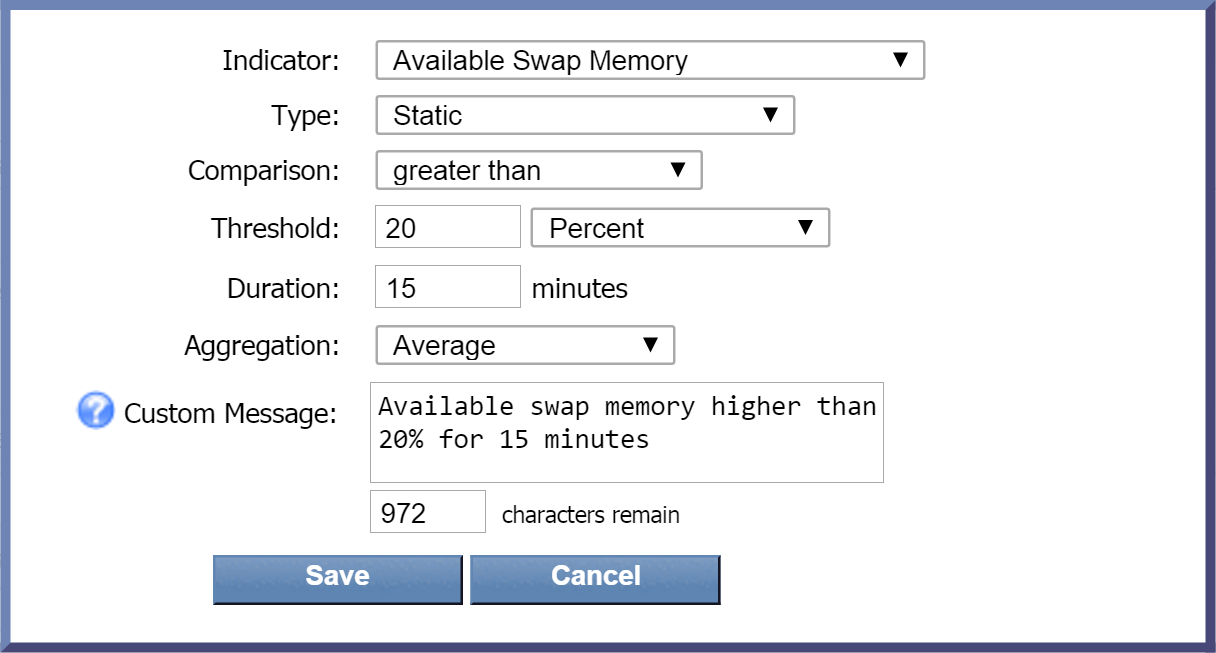
Some policies may include more than one condition. The AND boolean operator must meet both (or all) conditions. The OR boolean operator indicates that only one condition (or a set of conditions) must be met in order to trigger a threshold. In the following example, only one of the conditions (Rule 1 or Rule 2) listed under Alert Condition needs to be met. In this case, a separate rule for each condition is required when creating a condition from the Trigger Conditions tab.

Recommended Policies & Thresholds
The following tables contain recommended policies for SevOne self-monitoring and are not automatically available with Self-monitoring installation.
Most of the entries in the tables are policies. However, a small number of the entries need to be configured as thresholds. Under column Policy, a threshold will appear as follows. There is a Note directly under the threshold name.
S1_SELFMON_Disk_UtilizationRed
Note: This is a Threshold rather than a Policy.
In the tables below, each policy that begins with '_' contains the prefix S1_SELFMON. For example,
-
_memory_SwapRed must be read as S1_SELFMON_memory_SwapRed
-
_memory_SwapYellow must be read as S1_SELFMON_memory_SwapYellow
Selfmond policies are added in SevOne NMS by default whereas, the others may not be available automatically. The other policies will require manual configuration.
|
SYSTEM POLICIES |
||||||
|
Policy |
Applies To |
Plugin |
Alert Condition |
Clear Condition |
Suggested Remediation Steps |
Details |
|
_memory_SwapRed |
PAS HSA DNC |
SNMP
|
Memory (Linux (Net-SNMP))
|
Average Available Swap Memory > 20% over 15 minutes |
See Details before executing the following command. For CentOS, killall -9 SevOne-requestd; php /usr/local/scripts/periodic.shortterm.backup.php --force-backup; supervisorctl restart mysqld; php /usr/local/scripts/periodic.shortterm.backup.php --force-restore;
For Gentoo,
|
WARNING: This command may cause the loss of one poll cycle, and the past two hours of data may be briefly unavailable in the GUI (it will come back once the command finishes). This command will flush out any processes hogging up memory and will relieve the swap memory. |
|
_memory_SwapYellow |
PAS HSA DNC |
SNMP |
Memory (Linux (Net-SNMP))
|
Average Available Swap Memory > 50% over 15 minutes |
Execute the following command: killall -9 SevOne-requestd; |
Consider running the command for SevOne_SwapRed (previous row). Otherwise, keep tabs on swap usage. |
|
_Raid_Array |
NMS (PAS, HSA) |
Deferred |
Raid Array |
Average State = 4 over 15 minutes |
Execute the following command:
|
If degraded state is shown, replace failed disk. If rebuilding state is shown, array is healthy. |
|
_Raid_DiskPredictiveFail |
NMS (PAS, HSA) |
Deferred |
Raid Array Disk |
Average Predictive Failure Count = 0 over 15 minutes |
N/A |
Contact SevOne Support. SevOne will ask to reseat drive before replacing it. Replace failed disk. |
|
_Raid_DiskFailure |
NMS (PAS, HSA) |
Deferred |
Raid Array Disk |
Average Firmware State != 4 over 15 minutes
|
N/A |
Contact SevOne Support. SevOne will ask to reseat drive before replacing it. Replace failed disk. |
|
_Disk_UtilizationYellow Note: This is a Threshold rather than a Policy. |
NMS (PAS, HSA) |
SNMP
|
/ [specified partition]
|
Average Used Disk Space < 80% over 15 minutes |
N/A |
Review settings in Administration > Cluster Manager > Cluster Settings > Storage. Specify lower number for Data Retention and Maximum Disk Utilization if possible. |
|
_Disk_UtilizationRed Note: This is a Threshold rather than a Policy. |
NMS (PAS, HSA) |
SNMP |
/ [specified partition] Severity: Alert
Average Used Disk Space >= 90% over 15 minutes |
Average Used Disk Space < 90% over 15 minutes |
Execute the following command: trim-longterm --emergency-purge |
Use this policy for sd* objects, such as sda1, sdb, etc. This may indicate that the system is operating with a workload that is above or below its rated capacity. In case of system degradation, contact SevOne Support. |
|
_Disk_Reads |
NMS (PAS, HSA) |
SNMP |
Disk IO (Linux (Net-SNMP)) Note: For Type, specify Baseline Percentage. Average Number of reads > 150% of baseline over 50 minutes |
Average Number of reads < 150% of baseline over 50 minutes |
N/A |
Use this policy for sd* objects, such as sda1, sdb, etc. This may indicate that the system is operating with a workload that is above or below its rated capacity. In case of system degradation, contact SevOne Support. |
|
_Disk_Writes |
NMS (PAS, HSA) |
SNMP |
Disk IO (Linux (Net-SNMP)) Note: For Type, specify Baseline Percentage. Average Number of writes > 150% of baseline over 50 minutes |
Average Number of writes < 150% of baseline over 50 minutes |
N/A |
Use this policy for sd* objects, such as sda1, sdb, etc. This may indicate that the system is operating with a workload that is above or below its rated capacity. In case of system degradation, contact SevOne Support. |
|
_HSA_FAILOVER For this policy, we recommend creating a device group for the HSAs and applying the policy to that device group. |
NMS (PAS, HSA) |
Deferred Data |
SevOne Appliance |
Average Is master = 0 over 5 minutes |
|
|
|
_Memory_Available |
NMS (PAS, HSA) |
SNMP |
Physical Memory - Memory (Linux (Net-SNMP))
With a trigger for Available Memory < 5% over 15 minutes and w ith Average Aggregation. |
Available Memory > 5% over the past 15 minutes w
ith Minimum Aggregation. This will ensure that the alert is only cleared when the condition has remediated. |
|
|
|
_Ethernet_Traffic |
NMS (PAS, HSA) |
SNMP |
Interface
Note: For Type, specify Baseline Percentage. |
Average HC In Octets < 150% of baseline over 15 minutes
|
Consider moving devices to a different appliance. Otherwise, contact SevOne Support. |
|
|
_Ethernet_Errors |
NMS (PAS, HSA) |
SNMP |
Interface Note: For Type, specify Baseline Percentage.
Rule 1
Rule 3
|
Average In Errors < 120% of baseline over 15 minutes
Average In Discards < 120% of baseline over 15 minutes
|
|
|
|
_ALL_iDRAC_ICMPReachability Note: For this policy to work, you will need to add iDRACs to the Device Manager as separate devices, for example: Device 1 - SevOne (10.10.10.1) Device 2 - SevOne-idrac (10.10.10.2) |
NMS (PAS, HSA) |
ICMP
|
Ping Data |
Average Availability >= 95% over 15 minutes |
|
Check network connectivity to the appliance. If the network is okay, contact SevOne Support. |
|
_ALL_iDRAC_SNMPReachability |
NMS (PAS, HSA) |
SNMP |
SNMP Availability |
Average Availability >= 95% over 15 minutes |
If the iDRAC goes down, you will need to investigate server health, iDRAC connectivity, etc. |
If iDRAC health, etc., looks good, contact SevOne Support. |
|
CORE PROCESS POLICIES |
||||||
|
Policy |
Applies To |
Plugin |
Alert Condition |
Clear Condition |
Suggested Remediation Steps |
Details |
|
_requestd_Availability |
PAS HSA DNC |
Process Poller |
Process
|
Average Availability = 100% over 15 minutes |
Execute the following command:
For CentOS,
For Gentoo, |
If the command fails, check firewall access on port 60006 (TCP). |
|
_requestd_CPUTime |
PAS HSA DNC |
Process Poller |
Process
|
Average CPU Time < 1000 Milliseconds over 15 minutes |
|
|
|
_requestd_Memory |
PAS HSA DNC |
Process Poller |
Process
|
Average System memory used < 5 GB over 15 minutes |
N/A |
Check network connectivity to the appliance. If the network is okay, contact SevOne Support. |
|
_apache2_Availability |
PAS HSA DNC |
Process Poller |
Process |
Average Availability = 100% over 15 minutes |
Execute the following command: For CentOS, N/A
For Gentoo,
|
If the command fails, check firewall access on ports 80 and 443 (TCP). |
|
_apache2_CPUTime |
PAS HSA DNC |
Process Poller |
Process
|
Average CPU Time < 150% of baseline over 15 minutes |
|
|
|
_apache2_Memory |
PAS HSA DNC |
Process Poller |
Process
|
Average System memory used < 150% of baseline over 15 minutes |
|
|
|
_apache2_ThreadCount |
PAS HSA DNC |
Process Poller |
Process
Note: For Type, specify Baseline Percentage. |
Average System memory used < 150% of baseline over 15 minutes |
|
|
|
_polld_Availability |
PAS HSA DNC |
Process Poller |
Process
|
Average Availability = 100% over 15 minutes |
Execute the following command:
For CentOS,
For Gentoo,
|
If the command fails, contact SevOne Support. |
|
_polld_CPUTime |
PAS HSA DNC |
Process Poller |
Process
|
Average CPU Time < 150% of baseline over 15 minutes |
|
|
|
_polld_Memory |
PAS HSA DNC |
Process Poller |
Process
|
Average System memory used < 150% of baseline over 15 minutes |
|
|
|
_polld_ThreadCount |
PAS HSA DNC |
Process Poller |
Process Note: For Type, specify Baseline Percentage. Average Instances of the process > 150% of baseline over 15 minutes OR Average Instances of the process < 50% of baseline over 15 minutes |
Average Instances of the process < 150% of baseline over 15 minutes
|
|
|
|
_mysqlData_Availability The object subtype for this policy, mysqld, applies to both the MySQL Config database and the MySQL Data database.
|
PAS HSA DNC |
Process Poller |
Process |
Average Availability = 100% over 15 minutes |
Execute the following command:
For CentOS,
For Gentoo,
|
If the command fails, check firewall access on ports 3306 and 3307 (TCP). |
|
_mysqldData_CPUTime The object subtype for this policy, mysqld, applies to both the MySQL Config database and the MySQL Data database. |
PAS HSA DNC |
Process Poller |
Process
Note: For Type, specify Baseline Percentage.
|
Average CPU Time < 150% of baseline over 15 minutes |
|
|
|
_mysqlData_Memory The object subtype for this policy, mysqld, applies to both the MySQL Config database and the MySQL Data database. |
PAS HSA DNC |
Process Poller |
Process
Note: For Type, specify Baseline Percentage.
|
Average System memory used < 150% of baseline over 15 minutes |
|
|
|
_mysqlData_ThreadCount The object subtype for this policy, mysqld, applies to both the MySQL Config database and the MySQL Data database. |
PAS HSA DNC |
Process Poller |
Process Note: For Type, specify Baseline Percentage. Average Instances of the process > 150% of baseline over 15 minutes OR Average Instances of the process < 50% of baseline over 15 minutes |
Average Instances of the process < 150% of baseline over 15 minutes
|
|
|
|
_sshd_Availability |
PAS HSA DNC |
Process Poller |
Process
|
Average Availability = 100% over 15 minutes |
Execute the following command:
For CentOS,
For Gentoo,
|
If the command fails, check firewall access on port 22 (TCP). |
|
_sshd_CPUTime |
PAS HSA DNC |
Process Poller |
Process
Note: For Type, specify Baseline Percentage.
|
Average CPU Time < 150% of baseline over 15 minutes |
|
|
|
_sshd_Memory |
PAS HSA DNC |
Process Poller |
Process
Note: For Type, specify Baseline Percentage.
|
Average System memory used < 150% of baseline over 15 minutes |
|
|
|
_crond_Availability |
PAS HSA DNC |
Process Poller |
Process
|
Average Availability = 100% over 15 minutes |
|
|
|
_crond_CPUTime |
PAS HSA DNC |
Process Poller |
Process
Note: For Type, specify Baseline Percentage.
|
Average CPU Time < 150% of baseline over 15 minutes |
|
|
|
_crond_Memory |
PAS HSA DNC |
Process Poller |
Process
Note: For Type, specify Baseline Percentage.
|
Average System memory used < 150% of baseline over 15 minutes |
|
|
|
_datad_Availability |
PAS HSA DNC |
Process Poller |
Process
|
Average Availability = 100% over 15 minutes |
Execute the following command:
For CentOS,
For Gentoo,
|
If the command fails, contact SevOne Support. |
|
_datad_CPUTime |
PAS HSA DNC |
Process Poller |
Process
Note: For Type, specify Baseline Percentage.
|
Average CPU Time < 150% of baseline over 15 minutes |
|
|
|
_datad_Memory |
PAS HSA DNC |
Process Poller |
Process
Note: For Type, specify Baseline Percentage.
|
Average System memory used < 150% of baseline over 15 minutes |
|
|
|
_masterslaved_Availability |
PAS HSA DNC |
Process Poller |
Process
|
Average Availability = 100% over 15 minutes |
Execute the following command:
For CentOS,
For Gentoo,
|
If the command fails, check firewall access on port 5050 (TCP). |
|
_masterslaved_CPUTime |
PAS HSA DNC |
Process Poller |
Process
Note: For Type, specify Baseline Percentage.
|
Average CPU Time < 150% of baseline over 15 minutes |
|
|
|
_masterslaved_Memory |
PAS HSA DNC |
Process Poller |
Process
Note: For Type, specify Baseline Percentage.
|
Average System memory used < 150% of baseline over 15 minutes |
|
|
|
_ntpd_Availability |
PAS HSA DNC |
Process Poller |
Process
|
Average Availability = 100% over 15 minutes |
Execute the following command:
For CentOS,
For Gentoo,
|
If the command fails, check firewall access on port 123 (UDP). |
|
_ntpd_CPUTime |
PAS HSA DNC |
Process Poller |
Process
Note: For Type, specify Baseline Percentage.
|
Average CPU Time < 150% of baseline over 15 minutes |
|
|
|
_ntpd_Memory |
PAS HSA DNC |
Process Poller |
Process
Note: For Type, specify Baseline Percentage.
|
Average System memory used < 150% of baseline over 15 minutes |
|
|
|
_netflowd_Availability |
DNC |
Process Poller |
Process
|
Average Availability = 100% over 15 minutes |
Execute the following command:
For CentOS,
For Gentoo,
|
If the command fails, contact SevOne Support. |
|
_netflowd_CPUTime |
DNC |
Process Poller |
Process
Note: For Type, specify Baseline Percentage.
|
Average CPU Time < 150% of baseline over 15 minutes |
|
|
|
_netflowd_Memory |
DNC |
Process Poller |
Process
Note: For Type, specify Baseline Percentage.
|
Average System memory used < 150% of baseline over 15 minutes |
|
|
|
Selfmond: peer is not reachable via SSH |
PAS HSA DNC |
SNMP Poller |
One or more peers are not reachable via SSH.
|
No |
|
|
|
Selfmond: updater has fallen behind |
PAS HSA DNC |
SNMP Poller |
Updater has fallen behind.
|
No |
|
|
|
Selfmond: master-slave both master |
PAS HSA DNC |
SNMP Poller |
Both appliances think that they are leader. |
No |
|
|
|
Selfmond: master-slave active appliance |
PAS HSA DNC |
SNMP Poller |
Active appliance is changed.
ActiveAppliance changed over 5 minutes |
No |
|
|
|
Selfmond: Config Db replication is too much behind |
PAS HSA DNC |
SNMP Poller |
Config Db replication is too much behind for normal operations.
Average SecondsBehindMaster > 300 over 5 minutes |
No |
|
|
|
Selfmond: Data Db replication is too much behind |
PAS HSA DNC |
SNMP Poller |
Data Db replication is too much behind for normal operations.
Average SecondsBehindMaster > 300 over 5 minutes |
No |
|
|
|
Selfmond: / mount point become read-only |
PAS HSA DNC |
SNMP Poller |
/data mount point become read-only.
Object Type: SevOne Process (Linux (Net-SNMP))
|
No |
|
|
|
Selfmond: /data mount point become read-only |
PAS HSA DNC |
SNMP Poller |
/data mount point become read-only.
|
No |
|
|
|
Selfmond: /iodrive mount point become read-only |
PAS HSA DNC |
SNMP Poller |
/iodrive mount point become read-only.
|
No |
|
|
|
Selfmond: no polled indicators |
PAS HSA DNC |
SNMP Poller |
Object Type: SevOne Process (Linux (Net-SNMP)) |
No |
|
|
|
Selfmond: report mailer has fallen behind |
PAS HSA DNC |
SNMP Poller |
Object Type: SevOne Process (Linux (Net-SNMP)) |
No |
|
|
|
Selfmond: keys expired |
PAS HSA DNC |
SNMP Poller |
Object Type: SevOne Process (Linux (Net-SNMP)) |
No |
In NMS console on any peer execute the following command: SevOne-act activate-crypto-permissions --uid <USER ID> where, <USER ID> is the user with expired crypto key |
Crypto keys are used for decrypting sensitive information obtained by REST API and are generated in NMS console by SevOne-act activate-crypto-permissions |
|
Selfmond: SevOne-netflowd has fallen behind |
PAS HSA DNC |
SNMP Poller |
Object Type: SevOne Process (Linux (Net-SNMP)) |
No |
|
|
|
Selfmond: SevOne-ffupdater has fallen behind |
PAS HSA DNC |
SNMP Poller |
Object Type: SevOne Process (Linux (Net-SNMP)) |
No |
|
|
|
CONFIGURATION POLICIES |
||||||
|
Policy
|
Applies To |
Plugin |
Alert Condition |
Clear Condition |
Suggested Remediation Steps
|
Details |
|
_Managed_Objects |
PAS HSA DNC |
Deferred Data |
SevOne Appliance
Note: For Type, specify Baseline Percentage.
OR Average Total objects enabled < 20% of baseline over 60 minutes |
No clear condition. If the alert condition triggers, there is likely a serious problem. The alert should be cleared manually once the issue has been addressed. |
|
|
|
_Disabled_Objects |
PAS HSA DNC |
Deferred Data |
SevOne Appliance
Note: For Type, specify Baseline Percentage.
OR Average Total objects disabled < 20% of baseline over 60 minutes |
No clear condition. If the alert condition triggers, there is likely a serious problem. The alert should be cleared manually once the issue has been addressed. |
|
|
|
XSTATS POLICIES |
||||||
|
Policy
|
Applies To |
Plugin |
Alert Condition |
Clear Condition |
Suggested Remediation Steps |
Details |
|
_bulkd_Availability (xStats Only) |
PAS |
Process Poller |
Process
|
Average Availability = 100% over 15 minutes |
|
|
|
_bulkd_CPUTime (xStats Only) |
PAS |
Process Poller |
Process
Note: For Type, specify Baseline Percentage.
|
Average CPU Time < 150% of baseline over 15 minutes |
|
|
|
_bulkd_Memory (xStats Only) |
PAS |
Process Poller |
Process
Note: For Type, specify Baseline Percentage.
|
Average System memory used < 150% of baseline over 15 minutes |
|
|
|
_bulkd_ThreadCount (xStats Only) |
PAS |
Process Poller |
Process
Note: For Type, specify Baseline Percentage. Average Instances of the process > 150% of baseline over 15 minutes OR Average Instances of the process < 50% of baseline over 15 minutes |
Average Instances of the process < 150% of baseline over 15 minutes AND Average Instances of the process > 50% of baseline over 15 minutes
|
|
|
|
_fcad_Availability (xStats Only) |
PAS |
Process Poller |
Process
|
Average Availability > 75% over 15 minutes |
|
|
|
_fcad_CPUTime (xStats Only) |
PAS |
Process Poller |
Process
Note: For Type, specify Baseline Percentage.
|
Average CPU Time < 120% of baseline over 15 minutes |
|
|
|
_fcad_Memory (xStats Only) |
PAS |
Process Poller |
Process
Note: For Type, specify Baseline Percentage.
|
Average System memory used < 150% of baseline over 15 minutes |
|
|
|
_fcad_ThreadCount (xStats Only) |
PAS |
Process Poller |
Process
Note: For Type, specify Baseline Percentage. Average Instances of the process > 150% of baseline over 15 minutes OR Average Instances of the process < 50% of baseline over 15 minutes |
Average Instances of the process < 150% of baseline over 15 minutes AND Average Instances of the process > 50% of baseline over 15 minutes |
|
|
Uninstall Self-monitoring
There are a handful of instances when it may become necessary to uninstall the Self-monitoring components. Removal and re-installation is the most efficient way to update Self-monitoring in the event of an IP address change, SevOneStats user password change, etc. Users must ensure that their root user's crontab is backed up prior to executing the following commands as this script makes modifications to the crontab.
-
Backup root user's crontab.
$crontab-l >/root/root_crontab_backup-`date+%s`.txt -
Change directory to /usr/local/scripts/utilities/plugins/selfmon.
$cd/usr/local/scripts/utilities/plugins/selfmon -
Run uninstall.sh script and follow the prompts OR run the script in a single line as shown below.
$ (echo-e'\n') |/usr/local/scripts/utilities/plugins/selfmon/uninstall.sh -
Validate that the root user's crontab no longer contains the following lines.
*/5* * * * php/usr/local/scripts/utilities/plugins/selfmon/RAIDMon/poll.megacli.objects.php -i"2"--api'127.0.0.1'>>/var/SevOne/RAIDMon.log 2>&1*/5* * * */usr/local/scripts/utilities/plugins/selfmon/SevOneMon/sevone.deferreddata.poll.sevone --api 127.0.0.1 --device-id"2"--object'SevOne Statistics'>>/var/SevOne/SevOneMon.log 2>&1*/5* * * */usr/local/scripts/utilities/plugins/selfmon/MySQLMon/sevone.deferreddata.poll.mysql --api 127.0.0.1 --device-id"2"--database 127.0.0.1:3307 --object'MySQL Config Database'--database-profile"config">>/var/SevOne/MySQLMon.log 2>&1*/5* * * */usr/local/scripts/utilities/plugins/selfmon/MySQLMon/sevone.deferreddata.poll.mysql --api 127.0.0.1 --device-id"2"--database 127.0.0.1:3306 --object'MySQL Data Database'--database-profile"data">>/var/SevOne/MySQLMon.log 2>&1*/5* * * * php/usr/local/scripts/utilities/plugins/selfmon/PolldMon/deferreddata.polld.php --api 127.0.0.1 --device-id"2"--polld-object'SevOne-polld performance'--highpolld-object'SevOne-highpolld performance'>>/var/SevOne/PolldMon.log 2>&1*/5* * * * php/usr/local/scripts/utilities/plugins/selfmon/RedisMon/sevone.deferreddata.poll.redis --api 127.0.0.1 --device-id"2"--object'Redis Instance'>>/var/SevOne/RedisMon.log 2>&1
Troubleshooting
Changed SevOneStats password after enabling Self-monitoring. Now, it is not working.
SevOne strongly suggests against changing the password for the API user SevOneStats after self-monitoring is enabled. However, if you have changed the password once self-monitoring is already in progress and you are experiencing problems, please contact the SevOne Support team for assistance.